Questions?
Problem set 7, question 3: use partial derivatives as rates of change.
Partial Derivatives Problem Set
See handout for details.
The Chain Rule
Section 4.5.
The Idea
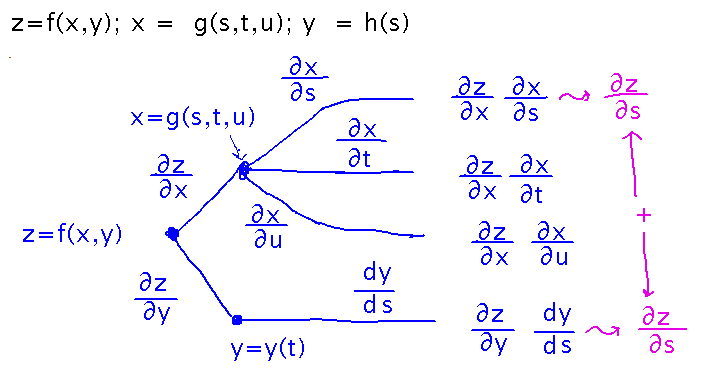
Suppose z = f(x,y), x = g(s,t,u), and y = h(s).
Draw a tree diagram for the partial derivatives of z with respect to s, t, and u.
A tree diagram is a device for remembering the sums of products of derivatives that appear in general (i.e., multivariable) applications of the chain rule. It’s a branching diagram whose intersection points represent functions and whose branches represent the various derivatives of those functions. You can find expressions for the products needed in a particular derivative by multiplying the derivatives on the links of paths from the “root” (i.e., outermost function, aka dependent variable) to the endpoints. The derivative of the outermost function with respect to independent variable x is the sum of all these products whose last derivative is also with respect to x.

So you can use a tree diagram to read off the expressions for various derivatives of the dependent variable. For example here are the partial derivatives of z with respect to s, t, and u.

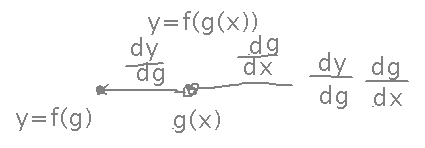
Notice that the chain rule for single-variable functions also has a tree diagram:

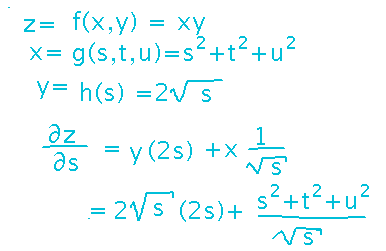
You can use the expressions built via the chain rule (i.e., read off a tree diagram) to find derivatives of compositions of multivariable functions:

But unlike the chain rule for single-variable functions, it’s often just as easy to find actual derivatives by writing intermediate variables in terms of independent variables in the outermost function and then differentiating:

I find the general chain rule much more valuable as a tool in proofs and other reasoning about multivariable functions than as a way of actually calculating derivatives.
Key Points
The chain rule for multivariable functions.
Tree diagrams as a way of remembering it.
Next
Directional derivatives and the gradient.
Read section 4.6.