Misc
Review Session
Thursday, May 9 (study day)
1:00 - 2:00
In our regular classroom (Sturges 221).
Bring things you want to talk about.
SI
Last regular session is today, 3:00, Bailey 209.
Next Wednesday’s session will be a double-length review, 4:00 - 7:00, Bailey 209.
Final Exam
Thursday, May 16, 12:00 Noon.
In our regular room.
Comprehensive, but emphasizing material since the 2nd hour exam (e.g., Mean Value Theorem, limits at infinity, Riemann sums, definite integrals, substitution, applications of integration; roughly problem sets 7 through 9).
Rules and format otherwise similar to hour exams, especially open-references rule.
Designed for about 2 hours, you’ll have 3 hours 20 minutes
Practice questions are now available in Canvas.
I’ll bring donuts and cider.
SOFIs
SOFIs are under way.
Please fill them out. I do read them and apply the feedback where possible to future classes (like the mid-semester feedback).
Questions?
Area and Integration
“Area and the Definite Integral” in section 5.2.
Motivation
What is the integral from -1 to 1 of x3? Does it correspond intuitively to what you think the area between the graph of x3 and the x axis is? How would you calculate that area?
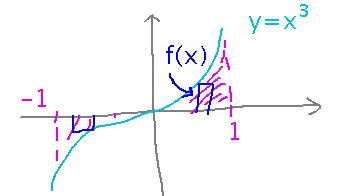
The integral works out to 0, yet clearly there is some area between the curve and the axis. The problem is that definite integrals use a function’s values as the “heights” of rectangles, so when the function is negative the rectangles have negative heights and thus negative areas. If you really want an integral to give you the area between a graph and the x axis, you need to integrate the function’s absolute value.

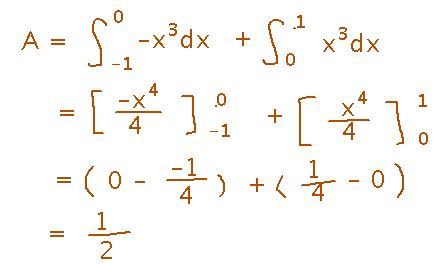
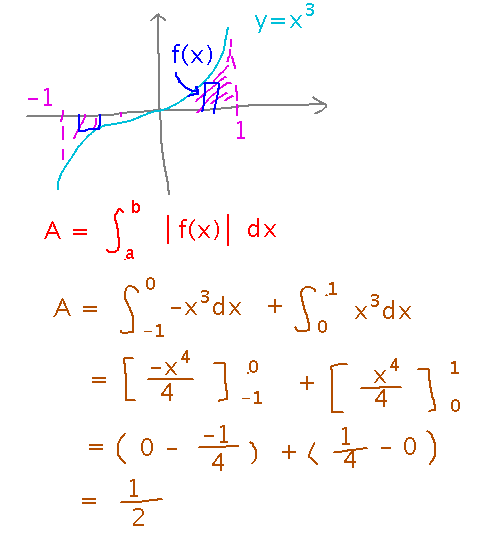
Now, since we don’t have an “absolute value” antiderivative rule, the way to actually do this is to split the interval you’re integrating over into subintervals according to whether the function (f) is positive or negative, and integrate either f for places where f(x) is positive, or -f for places where f(x) is negative. Here’s how that looks for the x3 example:
And here’s the complete example, as it looked when we finished with it:
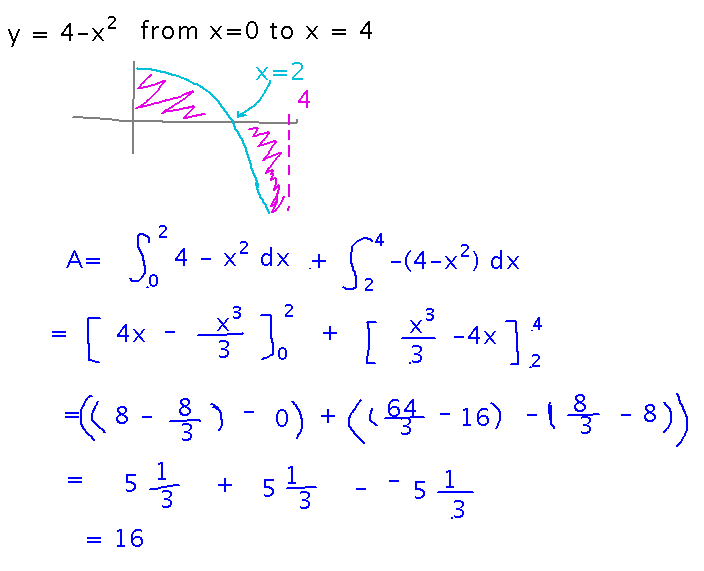
As another example, try finding the area between the x axis and y = 4 - x2 between x = 0 and x = 4.
The first thing you need to do in such problems is figure out where y is positive and where it’s negative. Do this by finding x values that make y 0, maybe aided by a graph of the function.
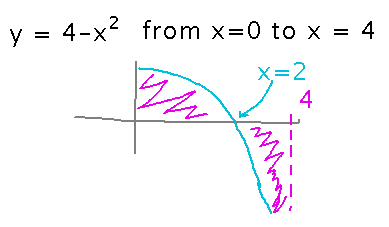
Now we know where to break the integration into sub-intervals, so we can proceed as we did for x3:
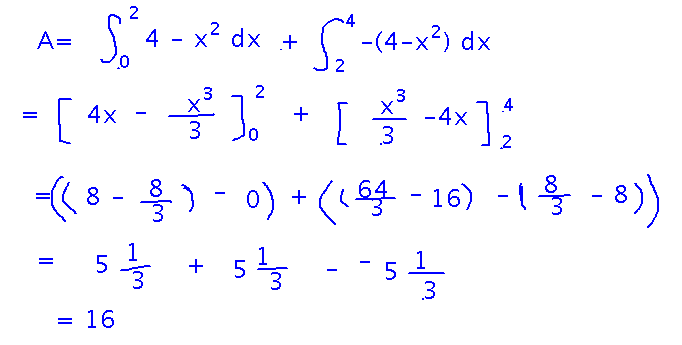
Here’s the complete problem, as it looked when we finished it:
Key Points
How to find the actual area between the graph of f(x) and the x axis over some interval:
- Find places in the interval where f(x) = 0
- Use those places to break the interval into sub-intervals over which f(x) doesn’t change sign
- Integrate f(x) over each sub-interval where it’s positive, and -f(x) over each sub-interval where f is negative
- Add all the integrals together to get the total area.
Next
Area between curves.
Example: Imagine a pond with borders y = 4 - x2 and y = x2. What is its surface area?
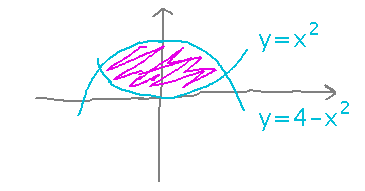
We can find the area by adding up the areas of lots of little rectangles, just as we did for area below a graph. Except this time the rectangles run between two graphs, so their heights are differences of the two functions’ values:
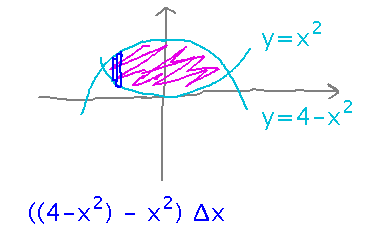
This is a Riemann sum, so we can calculate the exact area as an integral:

Here’s the derivation all together, as it looked when we finished it in class:
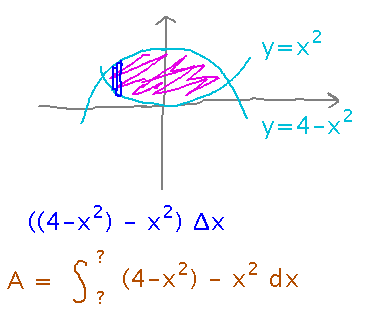
...But we need to figure out what the bounds are, and actually make sure we can do it. We’ll pick up with that on Monday.
Read section 6.1
At some point, probably during Monday’s class, we’ll start talking about volume by integration.