Misc
Colloquium
“Nonlinear Dynamics of the Heart”
Dr. Elizabeth Cherry, RIT
Friday, February 1, 3:30 - 4:30
Newton 214
Up to 2 problem set points of extra credit for going to the colloquium and writing roughly a paragraph on connections you make to it (e.g., connections you see between the subject and other classes you have taken or are taking, connections to your own interests, other personal connections, etc. Any connection will do, but a straight factual summary of what the speaker says won’t.)
Math Learning Center
Opens today, in South 332.
Hours are roughly
- Monday through Thursday: mid-day and evening
- Friday: mid-day
- Sunday: evening
See https://www.geneseo.edu/math/mlc for details
My Office
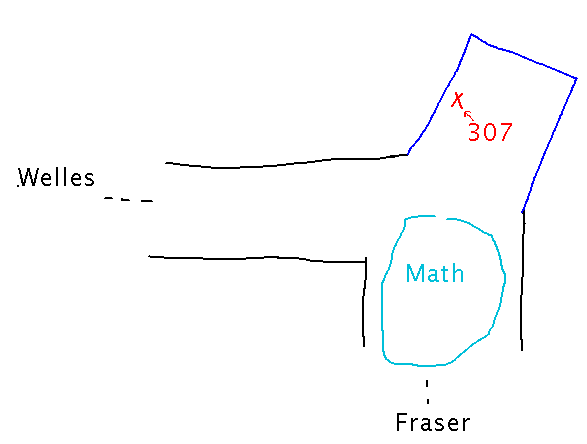
...is in South 307.
South Hall is roughly L-shaped, between Fraser and Welles. But there’s a little “nose” sticking out diagonally where the legs on the L meet. My office is in that “nose,” to the left as you walk in from the L, on the 3rd floor.
Questions?
Limits
First subsections of section 2.2
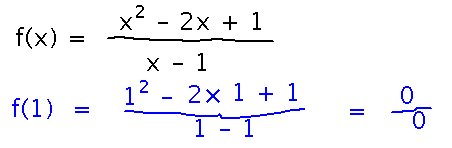
What can you say about f(x) = (x2 - 2x + 1) / (x - 1) at or near x = 1?
Just by plugging 1 in for x, we see that f(1) works out to 0/0, undefined.
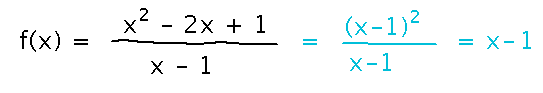
But note that the numerator in the definition of f factors, which simplifies the whole definition. Is that a simpler form of the same function? This idea is useful, as we’ll see in a few days, but it doesn’t give you a different form of the same function. The simplified one is defined everywhere, but the original is undefined at x = 1, so they must be different functions.
Estimating via Function Values
One way to build intuition is to try tabulating some values of the function for x near 1. We did so in this spreadsheet (https://docs.google.com/spreadsheets/d/1hjr5tlUFzEFy-B8YGUS89ShlRF0_Oe-CT7s29Gnh01I/edit?usp=sharing).
Sorting the results by increasing x value suggests that f(x) is heading for 0 as x heads for 1.
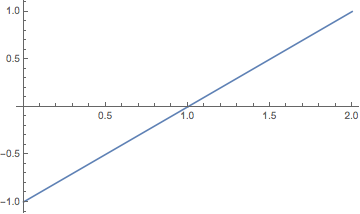
Estimating via Graphs
You can also try plotting f(x) near x = 1. This again suggests that as x gets close to 1, f(x) gets close to 0:
Another Example
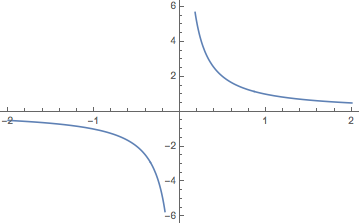
What about g(x) = 1/x near x= 0?
Here the graph strongly suggests that there is no limit, because there is no one value that f(x) closes in on as x approaches 0 (instead, f(x) gets ever larger as x approaches 0 from the positive side, but ever smaller as x approaches 0 from the negative side).
Problem Set
Mostly on evaluating limits by more rigorous means.
See handout for details.
You will turn in and grade the problem set in a face-to-face meeting with me. Here’s a tutorial on how you can use Google calendar to set up meetings (you can also set them up via email or just asking me in person before or after class though if you prefer).
Next
Now that we’ve been informally using technology tools for some of the math we’ve done, get started more formally with one that does more — look at how to plot graphs with Mathematica.
Be extra sure to bring your laptop to class, and have Mathematica installed on it before then. Instructions are at https://wiki.geneseo.edu/display/cit/Mathematica+Installation+and+Licensing+Instructions.
Also start looking at those “more rigorous means” of evaluating limits.
Read
- Evaluating Limits with the Limit Laws
- Limits of Polynomial and Rational Functions
in section 2.3