Anything You Want to Talk About?
(No.)
Basic Area between Curves
Based on “Area of a Region between Two Curves” in section 6.1 of the textbook, and the first examples in this discussion of areas between curves.
The Idea
Find the area between the curves y = x3 and y = x2 over the interval 1 ≤ x ≤ 2.

The discussion describes a solution to this problem, but it’s worth reviewing the details of how it came about.
First, the choice of which function to subtract from which is based on the values of the functions: you always subtract the function with the smaller values from the one with the larger values. So in this case we subtract x2 from x3 and integrate:

A little more interesting example: suppose that, maybe as a piece of art, I want to take the region between the curves y = cos x and y = sec2x between 0 and π/4, extrude it for 4 inches to make a solid, and 3D print it. What’s the total volume of my artwork? And what does it look like anyhow?
This is a good problem to use Mathematica on.
First, to get a sense of what this shape will look like, plot the curves in question:
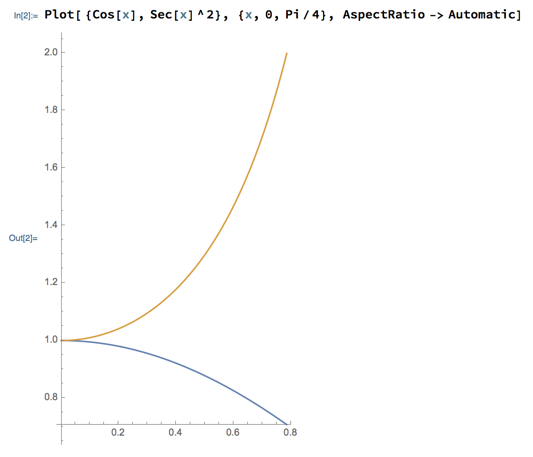
(The AspectRatio -> Automatic here is an option to Mathematica’s Plot function that scales the axes so that the units on each occupy the same space on the screen, thus giving you an accurate visual sense of sizes. This is helpful if you’re using a plot to judge how some real-world object looks.)
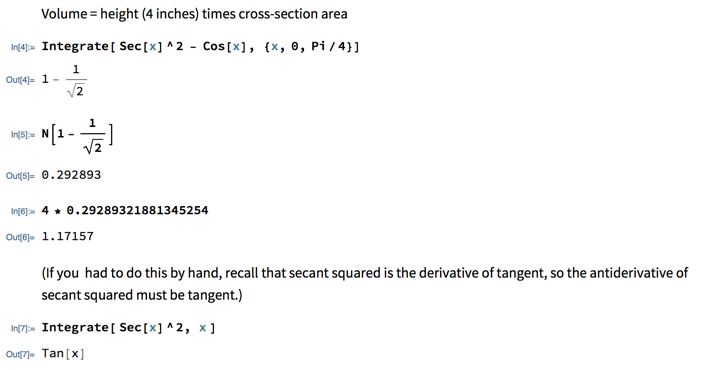
The cross-section of the sculpture will be the region between the two curves and the right side of the plot. If I imagine pulling that region out of the screen for a total of 4 inches (“extruding” it vertically), I get a volume that is just the distance I pulled the region (the height of the 3D shape) times its area. You can derive this by thinking of the volume as a Riemann sum of many very thin slices — something we’ll examine in more detail as our next application of integrals. You’ve also seen examples of it before, for example the formula for the volume of a cylinder of radius r and height h is V = πr2h, i.e., the area of the circular cross-section (πr2) times the height (h).
Now that we have a formula for the volume, we can have Mathematica calculate the area of the cross-section and then the volume:
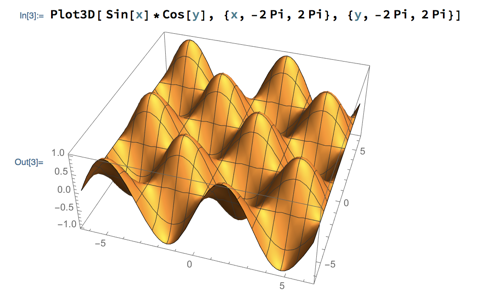
Question: can Mathematica plot 3 dimensional surfaces? Yes, it has a Plot3D function that does it. Plot3D is very similar to Plot, except the function it plots should have 2 variables, and you need to specify the range of values of both to plot over. For example:
This notebook contains all the Mathematica that we did today.
Process
Summarizing the process for, or key idea(s) behind, finding areas between curves so far:
- Graph both functions to identify which is larger and which is smaller
- Integrate larger minus smaller over the interval in question
Intersecting Curves
In a lot of area-between-curves problems, the area of interest is the area between places where the curves intersect. This is so much the case, in fact, that references to “the area between” two curves implicitly mean the area bounded by intersection points, if no other bounds are given.
For example, find the area between the curves y = x2 and y = 1 - x2 means the area of the little sliver in the middle of this plot:
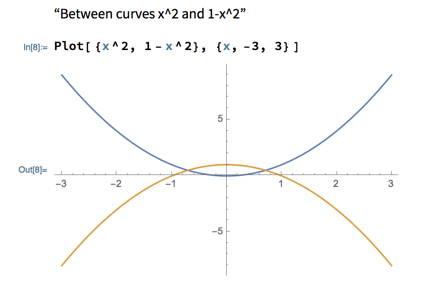
The strategy for solving such problems adds a “find the intersection points” step before integrating, in order to find the interval in question.
Next
Variations on area between curves, e.g., curves that cross, graphs that are discontinuous or defined piecewise, regions defined by more than 2 curves, etc.
Please read “Areas of Compound Regions” in section 6.1 of the textbook by class time Monday.
Please also keep contributing to the area between curves discussion, particularly the examples in the “More Complicated Forms” section.