Misc
Maddy’s survey re SI times is still open
Questions?
Intuitive Idea of Limit
“Intuitive Definition of Limit” from section 2.2.
Tabular Example
Suppose f(x) = (√x - 3) / (x - 9). Use a table of values of f(x) near x = 9 to estimate the limit of f(x) as x approaches 9.
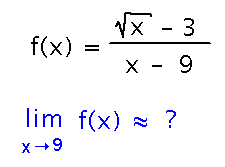
“Use a table of values” means listing values of f(x) for a number of values around (but not equal to) 9, and seeing what those listed values seem to be converging towards as x approaches 9. For example...
| x | (√x - 3) / (x - 9) |
|---|---|
| 8.9 | 0.1671 |
| 8.925 | 0.167 |
| 8.95 | 0.1669 |
| 8.975 | 0.16678 |
| 9.025 | 0.1665 |
| 9.05 | 0.1664 |
| 9.075 | 0.1663 |
In this case, it seems that f(x) would be right around 0.1666 and a bit more when x is 9. “0.1666 and a bit more” is just about 1/6, so a good estimate from this table is that the limit as x approaches 9 is 1/6.
Does it matter that f(9) = 0/0, which is undefined?
No, and in fact that’s where a lot of the value of limits lies — when they’re defined, they give you a way to find a surrogate for the actual value of a function when the function itself can’t be evaluated.
Graphing Example
Suppose f(x) = (x2 - 2x + 1) / (x-1). Use a graph of f(x) near x = 1 to estimate the limit of f(x) as x approaches 1. How about the limit as x approaches 0.5?
Mathematica for Graphing
Use more or less conventional notation for common mathematical operations (exponentiation is ^, division /, multiplication can be *)
Standard mathematical functions are also all available, e.g., Sqrt for square root, Sin for trigonometric sine, etc. Notice that function names always start with a capital letter. Also notice that function arguments are in square brackets, not parentheses.
Use the Plot function to draw graphs.
See the example done in class.
Interpreting Limits from Graphs
Estimate a limit by looking at what value the graph passes through, or at least seems to approach. In this example, that seems to be 0 as x approaches 1.
Does it matter that f(0.5) is defined? No, the central idea of a limit, how the function behaves as x gets close to something, still applies (it’s just less helpful, because you can calculate exactly what the function does at that x value). So for this example, the limit as x approaches 0.5 looks like about -0.5.
Problem Set
...on limits, some of which is from future classes
See handout for details.
Note the face-to-face grading: I expect you to finish this (e.g., be free to start the next one) by first thing Monday, September 8. But during that day and the next 2, you “turn it in” by coming to go over it with me.
Next
An important feature of mathematics: (almost) everything has a reason and comes from somewhere.
The formal definition of limit (i.e., the place all the limit material we’ll study in the next week or so comes from).
Read the “Quantifying Closeness” subsection of section 2.5 from the start up to but not including Example 2.39 (last 2/3 of page 194 almost to bottom of 195, in PDF)