SUNY Geneseo Department of Mathematics
Return to List of Lectures
Previous Lecture
Misc
Exam 1 is next Monday (Feb. 27)
It will cover material since the beginning of the semester (e.g., Matlab arithmetic, functions, variables, scripts, vectors, plotting, matrices, etc.)
There will be 3 to 5 short-answer questions (i.e., questions requiring about a paragraph of prose, 5 - 10 lines of code, etc. to answer)
You’ll have the whole class period to do the test
It will be open book, open notes, open computer to the extent you use the computer as a reference source. But you can’t communicate in real time with anyone except me during the test.
Questions?
The “extra” part of lab 3 means you can get a small amount of extra credit for doing it.
Matrix Multiplication
The Idea
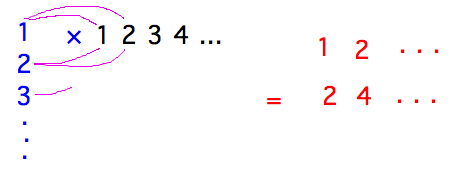
How could you use matrix multiplication to generate a multiplication table? (Use a matrix to represent the multiplication table, with row i column j holding the product ij.)
You basically want a row of 1, 2, 3, etc., and then multiply everything in that row by 1, then by 2, 3, etc.
You can do this by having the 1, 2, 3, etc. multipliers in a 1-column matrix on the left of the row (i.e., a 1-row matrix).

Carry this idea out in Matlab:
>> M1 = [ 1; 2; 3; 4; 5 ];
>> M1
M1 =
     1
     2
     3
     4
     5
>> M2 = [1,2,3,4,5]
M2 =
     1     2     3     4     5
>> M1 * M2
ans =
     1     2     3     4     5
     2     4     6     8    10
     3     6     9    12    15
     4     8    12    16    20
     5    10    15    20    25
Lab
Look over the handout.
Example: transforming the endpoint of a line segment.
Here’s a Matlab script that plots a line segment:
% Demonstrate simple matrix transformations of 2D points by transforming
% the endpoint of a line.


%% Define the original endpoint. Note that it's a column vector for later
% matrix multiplication.
endPt = [ 2; 1 ];


%% Draw a line from the origin to the endpoint.
line1X = [ 0, endPt(1) ];
line1Y = [ 0, endPt(2) ];
plot( line1X, line1Y, 'LineWidth', 2 );
axis( [ -1, 5, -1, 5 ] );
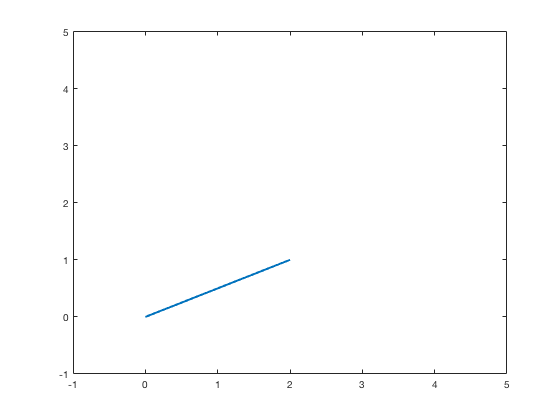
And here is the line it draws:

Now extend the script to add a new line whose endpoint is a scaled version of the first line’s:
% Demonstrate simple matrix transformations of 2D points by transforming
% the endpoint of a line.


%% Define the original endpoint. Note that it's a column vector for later
% matrix multiplication.
endPt = [ 2; 1 ];


%% Scale the endpoint by 1.5 units in x and 0.5 unit in y
scaledPt = [ 1.5, 0; 0, 0.5 ] * endPt;


%% Draw a line from the origin to the endpoint.
line1X = [ 0, endPt(1) ];
line1Y = [ 0, endPt(2) ];
line2X = [ 0, scaledPt(1) ];
line2Y = [ 0, scaledPt(2) ];
plot( line1X, line1Y, line2X, line2Y, 'LineWidth', 2 );
axis( [ -1, 5, -1, 5 ] );
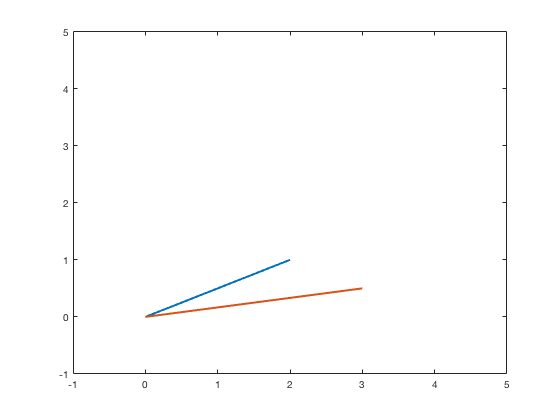
This time the script draws two lines, the new one having an endpoint that does indeed have an x coordinate 1 1/2 times larger than the original, and a y coordinate half as large:

Next
Lab day.
Next Lecture


