Questions?
Piecewise Vector-Valued Functions?
What’s going on with the long example of a piecewise vector-valued function at the end of the reading?
See the somewhat simpler example later in these notes.
Lines?
Since lines are sets of points, not sets of vectors, are they really defined by vector-valued functions?
As much as any curve is, thanks to subtle connections between vectors and points.
Vectors aren’t points, i.e., many of the things that geometrically make sense for vectors don’t make sense for points. For example, addition of vectors makes sense as “where you go if you go such-and-such a distance in this direction, and then this-and-that distance in that other direction,” but there’s no similar geometric meaning to adding points.
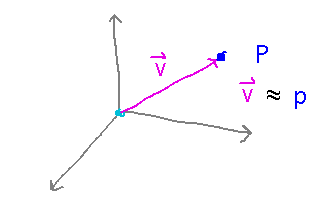
Nonetheless, it’s very natural to think of a point as being equivalent to the vector that would take you from the origin to that point.

The typical way of plotting a curve from a vector-valued function takes advantage of this equivalence: it plots the points at the ends of the vector, and says that the result is the plot of the function. In this sense, a vector-valued function form of the equation for a line produces vectors but still generates the line.
Vector-Valued Functions
First 5 subsections of section 12.1.
Key Ideas
A vector-valued function is a function of 1 variable whose value is a vector; each component is a function.
The domain is the intersection of component functions’ domains.
Basics
Let r(t) = 〈 2t2, t + 1, t2 - t 〉. Find some examples of values of r.
r(0) = ⟨ 0,1,0 ⟩, r(1) = ⟨ 2,2,0 ⟩, r(2) = ⟨ 8,3,2 ⟩
Are those values points or vectors? Vectors, but as discussed above they are often taken to be equivalent to points.
Plotting
Use the ParametricPlot3D function to do it in Mathematica. This notebook demonstrates.
Piecewise Definitions
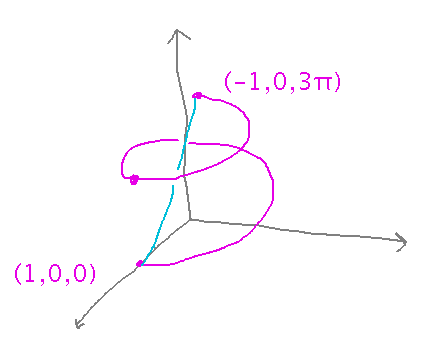
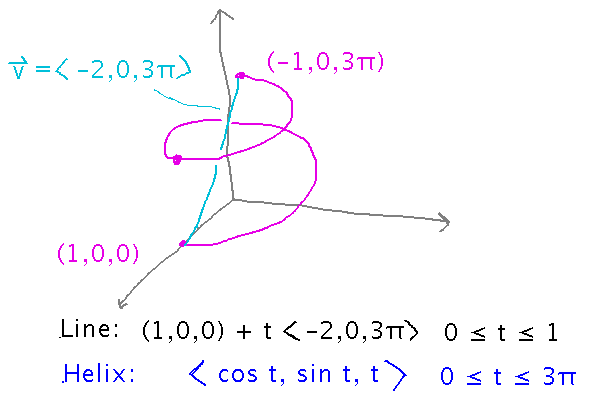
Define a vector-valued function that plots as 1 1/2 turns of a helix, with the ends of those turns connected by a straight line.:

One way to start is to come up with vector-valued functions that generate each piece separately. You can define the “pieces” in any way that seems easiest. There are generally many vector-valued functions that have the same plots, so you aren’t trying to find “the” right answer here, you’re trying to find “a” right answer.

Once you have the individual pieces, shift the domain (i.e., set of t values) for one up or down so that the domains don’t overlap. (Overlapping domains means that when you combine the pieces into a single function definition you have multiple results for the same input -- something that functions don’t do.)

This definition is OK, but it has an inelegant behavior around t = 1: the value jumps from ( -1, 0, 3π ) to ( 1, 0, 0 ). In other words, the function is discontinuous.
As an exercise for the listener (and/or topic for discussion at the start of class Monday -- which has now been requested, so we’ll do it), see if you can think of a way to fix this discontinuity.
Next
Start to do calculus with vector-valued functions.
Read “Limits and Continuity of a Vector-Valued Function” in section 12.1.