Misc
LaTeX Workshop
LaTeX is a powerful word processor (“typesetter” might be more accurate) for math. I highly recommend it for any writing that involves equations, cross-references, etc.
PRISM is running a workshop introducing it this Wednesday (Jan. 24) from 2:30 - 4:00 in South 329.
Dreamer Talk
“The Lonely Reality of an Academic Dreamer.”
Thursday (Jan. 25), 7:00 PM, Newton 202.
Prof. Pamela Harris, Williams College.
Colloquium
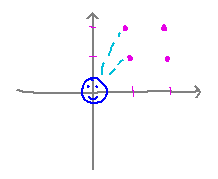
“Invisible Lattice Points”
Explores questions related to what integer-coordinate points you can “see” from the origin, if nearby points block your view of farther away ones.
Prof. Pamela Harris, Williams College.
Friday (Jan. 26), 2:30 PM, Newton 214.
Extra credit equivalent to up to 2 points on a problem set for going and writing a paragraph on connections you make to the talk. “Due” any time before our final exam.
Questions?
Plotting with muPad
Basic Concepts
To run muPad, start Matlab and then type mupad to the Matlab prompt.
muPad understands basic mathematical expressions made from addition (+), subtraction (-), multiplication (*, must be present in every multiplication), division (/), exponentiation (^) etc.
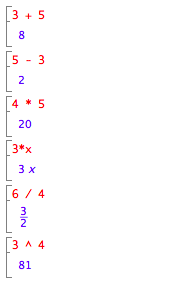
Arithmetic follows standard order-of-operation rules with parentheses to override.
![]()
Plotting
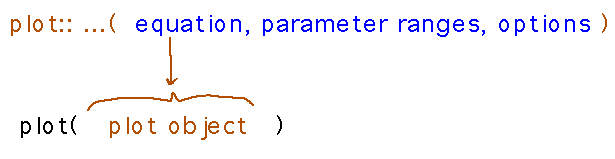
The basic model is a plot function that graphs “plot objects.” There are many muPad functions to create different sorts of plot objects, and lots of options for how to create each kind.
For example, plot::Implicit3d generates a plot object representing an implicit surface, i.e., the set of points (within a user-specified range) that make some equation hold. So here’s how to plot a simple sphere...
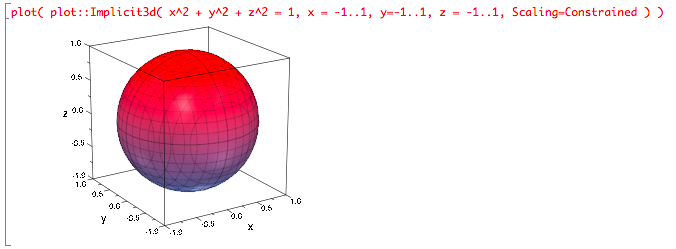
Notice the Scaling=Constrained option that ensures that the plotted surface uses equal-screen-length units in each dimension.
What if you want to mark the origin in the plot? I don’t know of a simple way to do this, but you can do it by exploiting the fact that plot can plot multiple plot objects in one command, along with a plot::Point3d function that creates a plot object representing a point.
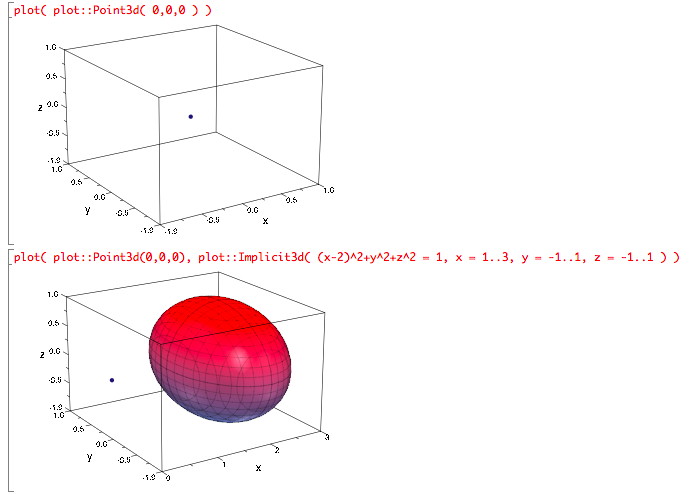
Notice that we didn’t use the Scaling=Constrained option, so the sphere looks distorted.
Explore for yourselves what happens if some of the terms in the sphere equation are multiplied or divided by constants other than 1.
Next
A broader set of implicit surfaces: cylinders and quadrics.
Read section 2.6.