Misc
LaTeX Workshop
LaTeX is a powerful word processor for mathematics (and anything else).
Workshop by PRISM for people who want to use it.
September 20 (Thursday, aka tomorrow), 5:30 PM, South 328.
Questions?
Vector Valued Functions
Beginning of section 3.1
Meaning
Suppose r(t) = 〈 2 sint, 3 cost, t 〉
Then r(0) =〈 0, 3, 0 〉, r(-π/2)= 〈 -2, 0, -π/2 〉. We found these by plugging the given parameter values (0 or -π/2) into the equations for the components of r(t).
Plotting
Mathematica ParametricPlot3D function plots these curves. Use ParametricPlot for 2D parametric curves.
Here are some examples.
Designing Functions
Suppose the populations of 4 cities grow over time as...
- City 1 starts with 100000 people, and then gains 1000 people per year
- City 2 starts with 50000 people and loses 250 per year
- City 3 starts with 200000 people and loses 1500 per year
- City 4 starts with 200000 people and gains 750 per year
Describe these populations as a vector valued function.
p(x) = 〈 100000 + 1000x, 50000 - 250x, 200000 - 1500x, 200000 + 750x 〉
So vector valued functions can have any number of dimensions, and don’t have to be things you intend to plot.
Can you come up with a vector valued function that traces a conical helix when plotted?
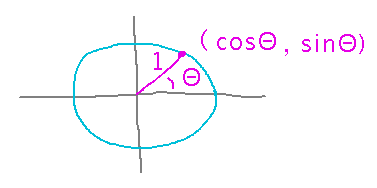
Yes, based on the ideas that sine and cosine functions in different components of the vector produce circular shapes in the curve:

Anything those sine and cosine functions are multiplied by affects the radius of the circle. So multiply sine and cosine by something increasing with t to make circles whose radius increases as t does, while the third component is linear in t.
There is specific code at the end of the examples.
Key Points
Concept of vector valued functions and their interpretation.
Plotting vector valued functions with Mathematica.
Next
Limits (and continuity) of vector valued functions.
Read “Limits and Continuity of a Vector-Valued Function” in section 3.1.