Questions?
Derivatives and Shapes of Graphs
Section 4.5.
Extreme Points
What do derivatives tell you about the extreme points of y = x - x1/3...?
Start by finding the derivative of y...
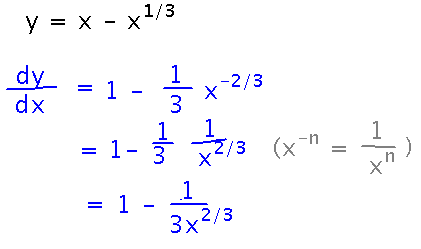
and then find x values that make the derivative 0:
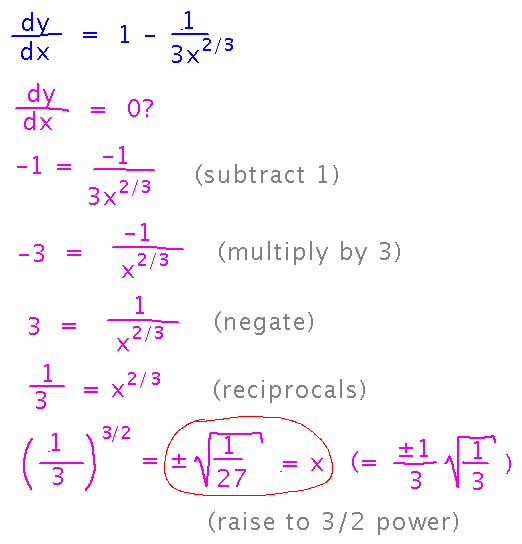
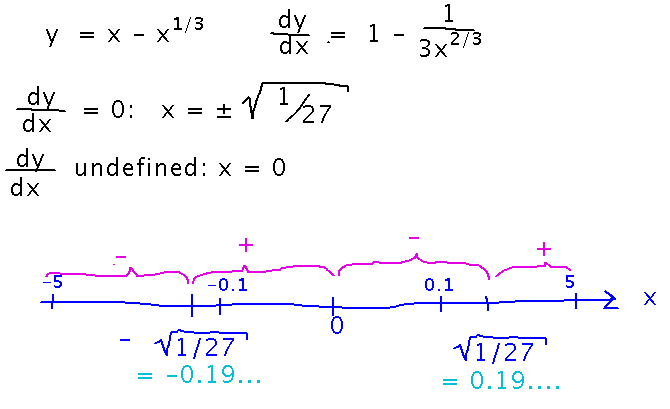
But beware! So far we haven’t had to deal with places where a derivative is undefined, but they also count as critical points. In this example, that gives us a third critical point at x = 0, because the denominator 3x2/3 is 0 there.
So now what do we do with these critical points, how do we decide which are minimums, maximums, etc?
First derivative test: if a derivative is positive (i.e., function is increasing) to the left of a critical point and negative (function is decreasing) to the right, then that critical point must correspond to a maximum. Similarly, if the derivative is negative to the left and positive to the right, the critical point must correspond to a minimum.
An easy way to apply this test is to calculate the sign of the derivative at more or less arbitrary test points between the critical points. As long as the derivative is continuous between critical points, it can only change sign at a critical point, so a single sample in each between-critical-points interval is enough to decide the sign of the derivative throughout that interval.
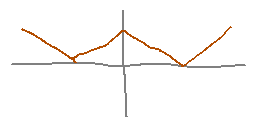
Here are some claims about signs of the derivative of x - x1/3 between its critical points, although the accuracy of those claims has to be checked. The x values chosen for samples were 0.1, 5, -0.1, and -5.
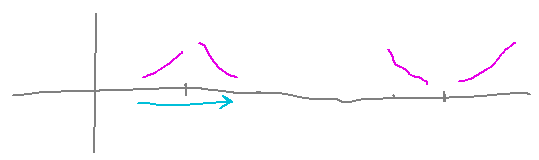
Based on these signs, the function’s graph might look something like this:
Summary of finding and classifying extreme points:
- Find critical points
- Find derivative
- Critical points occur where derivative is 0 or undefined
- Pick an x value in each interval between critical points at which to calculate the derivative (as long as the derivative is continuous in each such interval)
- Critical points where the sign of the derivative is negative to the left and positive to the right are minima, critical points where the derivative is positive to the left and negative to the right are maxima.
Next
Finish checking the signs of the derivative of x - x1/3 (I don’t believe they’re all right) and identifying minimums and maximums.
More about derivatives and the shapes of graphs, especially the 2nd derivative test.
Read about the 2nd derivative test in section 4.5 if you haven’t already.