Questions?
Grading for problem set 5 starts Thursday (March 28) and runs through next Monday (April 1).
Extreme Values
Section 4.3
Motivation: I blundered last Friday in my graph of y = x3 - 3x2. What was the blunder?
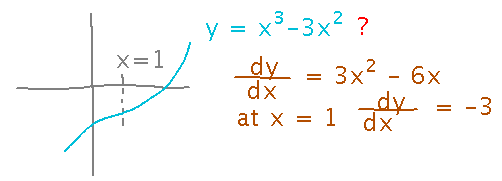
Answer: the graph of y = x3 - 3x2 can’t be going slightly upward as I drew it at a point where its derivative is negative.
Moral: Derivatives can help you gauge the shapes of graphs without necessarily drawing them in detail.
We’ll be working with pieces of this idea for the next several days. The first piece is finding places where functions hit maximum or minimum values.
Example
Where are the maximum and minimum values of y = x3 - 3x2 on the interval -3 ≤ x ≤ 3?
Ideas: local maxima and minima (i.e., points higher or lower than their immediate neighbors) are at x values where dy/dx is 0 (or undefined) — so-called critical points. Absolute maxima and minima are either at critical points or at the ends of the interval.
Start by finding critical points by finding dy/dx and solving for x values that make it 0 (there are no places where this derivative is undefined):
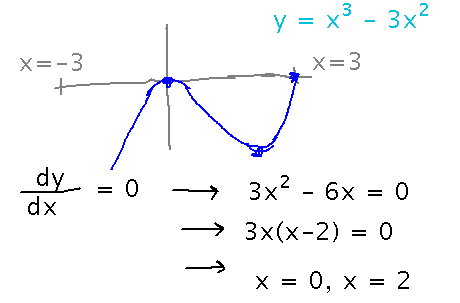
Critical points have x values of 0 and 2. To find the corresponding maximum/minimum (i.e., the y values), plug these x values into the equation and calculate y. In this case the points are (0,0) and (2,-4).
Next, check the ends of the interval (x = -3 and x = 3) for absolute maxima or minima. Plugging x = 3 into the equation gives y = 0, and x = -3 gives y = -54.
Based on the local maximum and minimum, and the values at the ends of the interval, I can sketch in a reasonable estimate of the graph. And I even know that there aren’t any unexpected turns in the graph between those points, because local maxima and minima can only happen at critical points (Fermat’s Theorem).
A Non-Curve-Sketching Example
Suppose the number of widgets Geneseo Widget Works makes with h hours of labor is w = 4h2 - 2h + 1. How many hours of labor should the Widget Works invest in?
Insight: invest in an amount that makes the derivative of w 0, because that corresponds to the maximum value of w. (Well, it’s the maximum, or the minimum, or maybe those occur at endpoints of some interval — but finding a place where dw/dh is 0 gives us a point to consider.)
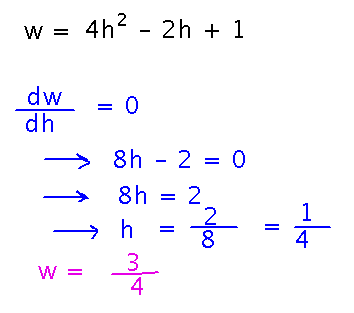
How do you know if this is a maximum or minimum? Since it’s the only critical point, we can compare the value of w at h = 1/4 to some other easy-to-compute value of w, and see if it’s higher or lower. For example, when h = 0, w = 1, so h = 1/4 is actually the minimally productive number of hours — the Widget Works should avoid that number, and go for as high a number of hours as they can (assuming negative hours aren’t possible, and they can afford enough hours to make more than 1 widget).
Next
More on extreme values: consolidating what we did today, looking more at pitfalls in it, and more examples.
No new reading.