SUNY Geneseo Department of Mathematics
Monday, February 13
Math 230 02
Spring 2017
Prof. Doug Baldwin
Video introduction
Example: come up with parametric equations that generate any sort of curve (but not one from the video or lab). Plot the curve with Matlab to make sure it looks like you expect.
Relevant ideas or questions from the video
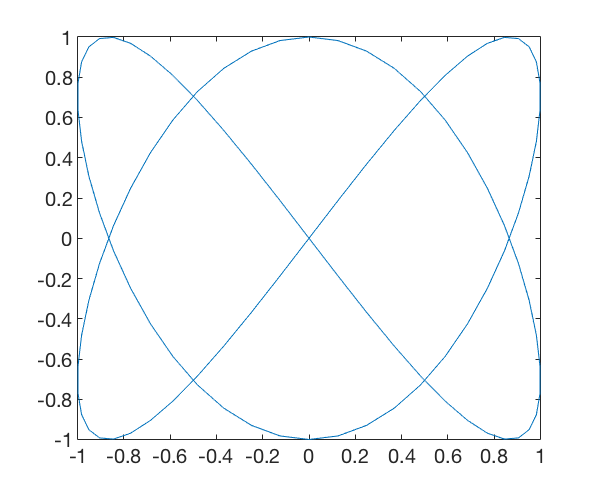
Equations: x = sin(2t), y = sin(3t)
Code to plot this curve:
%% Plot x(t) = sin(2t), y(t) = sin(3t)
t = [ -2*pi : pi/50 : 2*pi ];
x = sin( 2 * t );
y = sin( 3 * t );
plot( x, y )
Here’s what it looks like:

If you’re interested, you can also plot curves in 3-dimensional space, using the plot3 function, like this:
%% Demonstrate a 3D curve
t = linspace( -2*pi, 2*pi, 6000 );
x = sin( 8 * t );
y = 4 * cos( 8 * t );
z = tan( 8 * t );
plot3( x, y, z )
Parametrics and Explicit Functions: express the function y = x2 over the interval -2 ≤ x ≤ 2 as a pair of parametric equations, and try plotting them with Matlab.
The basic idea for parameterizing any explicit function: let the independent variable equal t, then replace occurrences of that variable with t in the equation for the dependent variable. For the above example, this would be
Now t ranges over the same values x would have, i.e., -2 ≤ t ≤ 2.
Lab day