SUNY Geneseo Department of Mathematics
Friday, February 10
Math 230 02
Spring 2017
Prof. Doug Baldwin
Terms related to functions?
“Call” a function: cause it to do its computation on a specific piece of data, e.g., y = f(6) in the command window or a script
“Define” a function: describe what it does, give it a name, etc., e.g., function [z] = f( wave ) .... end in a “.m” file
Sections 6.2 and 6.3
Plot a function: plot the curve y = sinx + x between x = -2π and x = 2π.
Useful ideas from reading
plot( ... ) plots a lineaxis( [ x1, x2, y1, y2 ] )
xlabel( 'label' ), ylabel(...), title(...)
'o' to plot points as circlesginput?
How do you plot a function rather than a pair of vectors?
Should you do plotting in a script or in a function?
Here’s the code to plot y = sinx + x:
>> % plot sinx + x from -2pi to 2pi
>> x = -2*pi : pi/6 : 2*pi;
>> y1 = sin(x) + x;
>> figure(1)
>> plot( x, y1, 'r' )
>> axis( [ -2*pi, 2*pi, -10, 10 ] )
Now add in a plot of y = x2 / 4 in a different color. A key idea is to use hold on to draw the new plot with the existing one, instead of replacing the existing one.
>> hold on
>> y2 = x.^2 / 4;
>> plot( x, y2, 'b' )
>> hold off
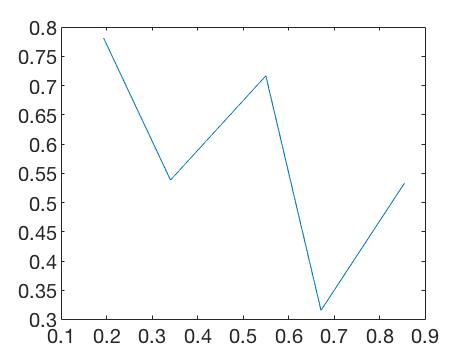
ginput records the positions at which you click your mouse, until you press the “Enter” key, at which point ginput returns vectors with the x and y coordinates of the clicks. Since ginput returns vectors of coordinates, you can plot them to track the path the mouse traced.
>> [clickX,clickY] = ginput()
clickX =
    0.1936
    0.3404
    0.5495
    0.6706
    0.8541
clickY =
    0.7809
    0.5384
    0.7166
    0.3156
    0.5334
>> plot(clickX,clickY)
This code produced this plot:

Lab 3: plotting parametric curves. See handout for details.
Parametric curves
Watch this video introduction to, or review of, parametric curves if you aren’t familiar with them (or see it at https://www.youtube.com/watch?v=tsnHL1Lb5MU):