Misc
SI session this afternoon, 3:00 - 4:30.
Questions?
Shapes of Graphs
Section 4.5
Key Idea(s)
First-derivative test for minima vs maxima: if derivative changes from positive to negative across a critical point, then the critical point is a local maximum; if derivative changes from negative to positive then the critical point is a local minimum.
Sign of second derivative gives information about concavity: positive second derivative means concave up, negative means concave down.
Thus there is a second derivative test for maxima/minima: a critical point where a graph is concave up (positive second derivative) must be a local minimum, while a critical point where a graph is concave down must be a local maximum.
First Derivative Example
Look at Example 4.17 in the book.
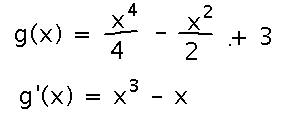
See if you can adapt its method to finding all local extrema of g(x) = x4/4 - x2/2 + 3. The first step is to find the derivative of g:
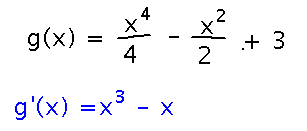
Then find places where the derivative is 0, just as in other extreme value problems:
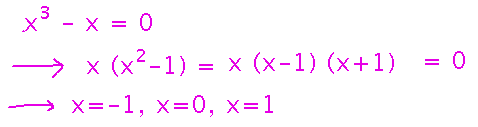
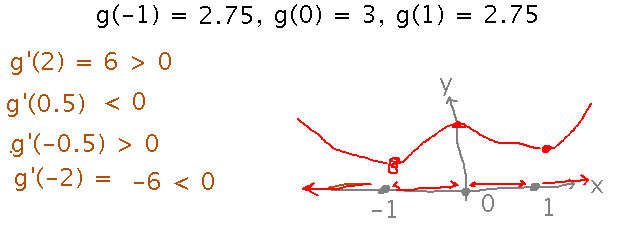
You could now find the values of g(x) at each critical point, although that’s not strictly necessary. What you do want is the sign of the derivative in the intervals between critical points. Between critical points the derivative can’t change sign (at least as long as the derivative is continuous), so it suffices to just evaluate the derivative at some convenient point in each interval:
Second Derivative Example
Look at Example 4.19 in the book.
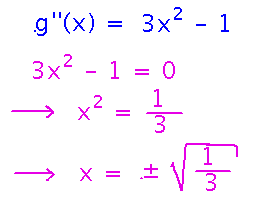
Adapt it to find intervals where g(x) = x4/4 - x2/2 + 3 is concave up and where it is concave down.
Here you want to know the second derivative, and where it is 0.
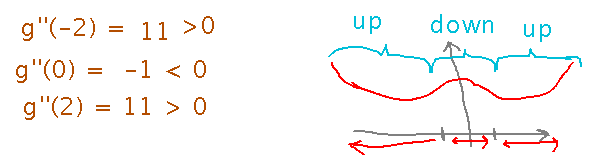
Having a second derivative of 0 means the first derivative is at a critical point, i.e., is changing from rising (which implies concave up) to falling (which implies concave down) or vice versa. So divide the domain of g into intervals between places where g’’(x) is zero, and the sign of g’’(x) in each interval tells you whether g is concave up in that interval (positive g’’) or concave down (negative g’’).
Graphing Game
Goal: see how closely someone else can reproduce a graph you have in mind using only information about the signs of its derivatives and limited information about its value.
Play:
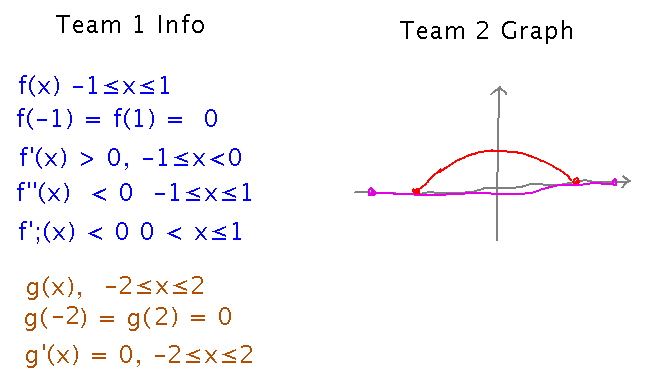
- Team 1 comes up with a shape they can describe as the graphs of one or more continuous functions over certain domains.
- Team 1 gives team 2 information about the values of their functions at the left and right ends of their domains, and the signs (positive, negative, or zero) of their function(s) derivatives over intervals in the domains.
- Team 2 draws their best estimate of team 1’s function(s).
For example...
Next
Play the graphing game.
Plan how you would describe a picture subject to the rules of the game.