Misc
Colloquia
Extra credit for writing paragraphs about connections you make to these, as usual.
Today
“Reconstructing the Past with Math: Evolutionary Trees from DNA Sequences”
Colby Long, Ohio State University (faculty candidate)
Monday November 27, 4:00 PM, Newton 201.
Friday
“Graph Coloring and Counting Increasing Forests”
Joshua Hallam, Wake Forest University (faculty candidate)
Friday, December 1, 2:30 PM, place TBA.
In this context, a “graph” isn’t a plot of a function, but rather a set of “vertices” representing things connected by “edges” representing relationships between things (e.g., two rooms are scheduled at the same time, two countries share a border). The graph coloring problem asks what is the minimum number of colors needed to color all the vertices in such a way that no vertices connected by an edge have the same color. Lots of mathematics has grown up around this problem in the past few centuries.
GROW STEM Workshop
The Imposter Phenomenon (aka imposter syndrome).
Wednesday, November 29, 3:00 - 4:00 PM, Milne 105.
Questions?
Problem set 10 does have to be graded by Wednesday (Nov. 29); I wasn’t able to rearrange other classes’ assignments to give you longer.
Volume by Slicing
What does this video have to do with the reading for today?
Answer: 3D printers build complicated solids by “printing” thin layers of plastic. This is a complement to dividing complicated solids into (infinitely) thin slices and adding their volumes to find the volume of the solid, as described in the reading.
Warm-Up Problem
What’s the volume of a cube sheared to 45 degrees?

Divide the “cube” into thin slices and add up their volumes:
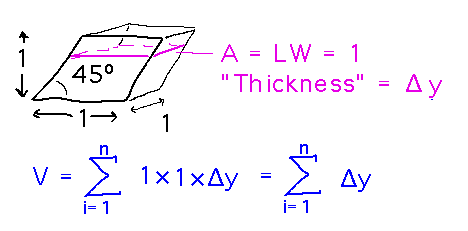
As the number of slices goes to infinity, this becomes an integral with the thickness of each slice represented by dy:

A More Interesting Problem
What’s the volume of a parabolic teacup produced by rotating the graph of y = x2/2 around the y axis, and limiting y to the interval 0 ≤ y ≤ 2?
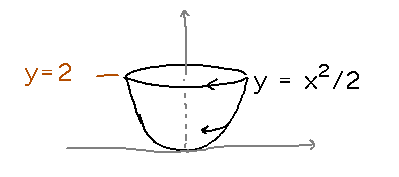
Use the same slicing strategy as before. The first step is to find a good axis to slice perpendicular to. The y axis is a good choice here, because then each slice is just a circle whose radius is x.

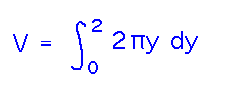
Now we can again integrate the “volumes” of the slices over all y coordinates in the cup to get its volume:
Problem Set
See handout for more information.
Next
Finish the teacup by evaluating the integral.
Then look at volumes via “washers.”
Read “The Washer Method” subsection of section 6.2 in our textbook.