MATH 222 - Logistic Population Growth
If we adjust our
model for exponential population growth so that the growth of the population
slows down as the population approaches a certain value we develop a more
realistic model called Logistic Growth.
Our original equation was ![]() . To this we add a
term to get the equation
. To this we add a
term to get the equation ![]() where M is the ideal
population for the particular environment.
M is usually called the “carrying capacity”. We add the initial condition N(0)=N0. To solve the equation we “separate the
variables” N and t.
where M is the ideal
population for the particular environment.
M is usually called the “carrying capacity”. We add the initial condition N(0)=N0. To solve the equation we “separate the
variables” N and t.

We need to simplify the left hand side by the method of “partial fractions”’.
![]() (Check this
equation.)
(Check this
equation.)
Thus ![]()
and ![]() .
.
Setting these equal we have ln(N)-ln(M-N)=kt+C, which yields
![]()
Using N(0)=N0 we have ![]()
In full detail our solution looks like this:  . Let
. Let  Then our equation becomes:
![]() .
.
Solving for N(t) yields ![]()
Then we have ![]()
Finally, let ![]() . Divide the numerator
and denominator by Aekt. Then
we have
. Divide the numerator
and denominator by Aekt. Then
we have ![]() .
.
Example 1. Suppose that N0 = 10, M = 100, and N(1) = 20.
A=10/(100-10)=10/90=1/9. B = 9.
The solution up to this point is ![]()
Using the last piece of information we have ![]() We solve for k:
We solve for k:
![]()
![]()
We have k = -ln(4/9) = ln(9/4).
The final solution is ![]() .
.
The graph of the solution is 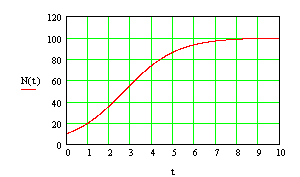
Notice that the horizontal line N(t)=100 is a horizontal asymptote.
Exercise1. Find the solution N(t) for N0 = 5, M = 100, and N(1) = 15. Graph the solution on the calculator.
Exercise 2. Find the solution N(t) for N0 = 25, M = 1000, and N(2) = 60. Find the value of t at which N(t) = 500 = M/2.
Exercise 3. Find N(t) if N0 = 10, M = 50, and N(2) = 20. For what t does N(t)=45?
Graph the solution. For what value of t is N(t) rising the most steeply? What is N equal to at that value of t?
Exercise 4. Suppose that a population starts at a level above the carrying capacity. What does the model predict? Let N0 = 150 and M = 100. Also suppose that N(1)=125. Find N(t) and graph the result.