- Grading date for lab 2 is now Thursday, Feb 18
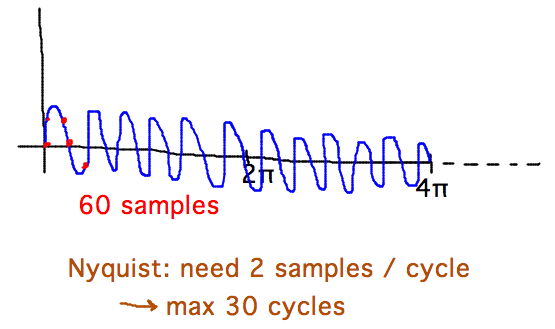
- How should frequencies of sine wave behave in vector lab?
- Stay constant as you increase range of x values because number of cycles generated increases exactly proportionally to that range
- …Until range gets so large that you have less than 2 samples per cycle and
Nyquist’s Theorem kicks in

- Sections 6.1 and 6.2
- Plot = show data in graph
- x and y axes assumed based on data until you change them
- Can title axes with
xlabel,ylabel - Lots of different functions for different kinds of graph, e.g.,
plot- central plotting functionplot( xvector, yvector )
plotyy
- Functions to customize graphs
- Examples
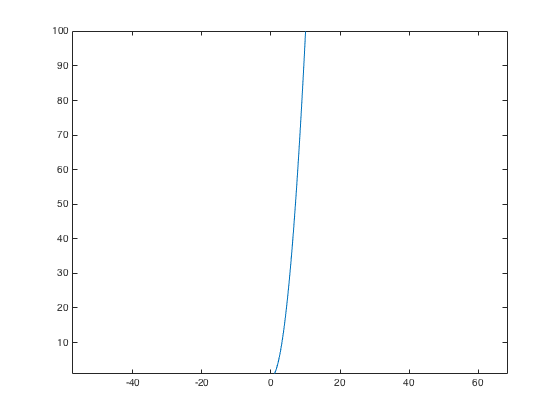
- Plot y =x2 over 1 ≤ x ≤ 10
>> % Plot y = x^2
>> % Algorithm: make vector of xs
>> % make vector of ys
>> % plot xs, ys
>> xs = linspace( 1, 10 );
>> ys = xs .^ 2;
>> plot( xs, ys );
>> axis square
>> axis equal
- Order of growth (plot 2 functions in different colors)
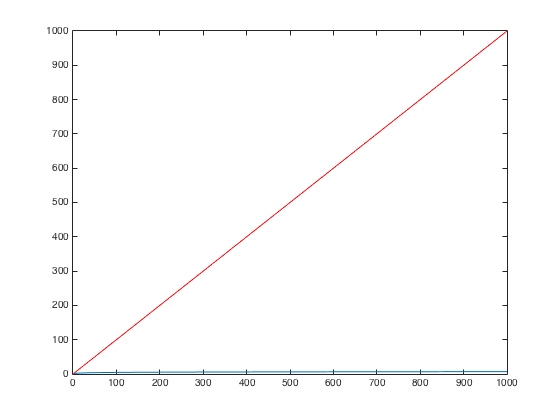
- x vs ln x
- Tendency to think of ln x as roughly same size as x, just leveling off

- Reality for modestly large x values is that ln x might as well be 0
>> % Plot y = log x and y = x on same axes
>> clf
>> xs = linspace( 1, 1000, 1000 );
>> ys = log( xs );
>> hold off
>> plot( xs, ys );
>> hold on
>> plot( xs, xs, 'r' )
- Plot y =x2 over 1 ≤ x ≤ 10
- Handout
- Grade by February 25
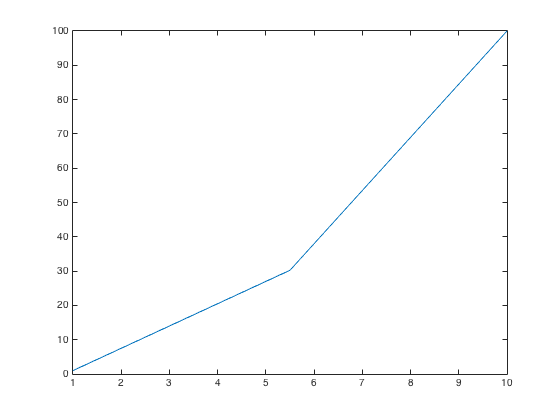
- Jagged graphs may result from plotting over too few t values
>> % Jagged graph
>> xs = linspace( 1, 10, 3 );
>> ys = xs .^ 2;
>> clf
>> plot( xs, ys )
- Parametric Equations
- Watch “Parametric Curves — Basic Graphing” video at https://www.youtube.com/watch?v=tsnHL1Lb5MU