- Section 3.5
- Graphing
- e.g., single points
- Multiple points in lists of x and y coordinates
- Can change markers, colors, line styles
- Can also do bar graphs
- Multiple graphs on same axes
- Can label axes, scales, etc.
- Example
>> % plot a box
>> % (1,1), (1,2), (4,1), (4,2)
>> x = [1 1 4 4]
x =
    1     1     4     4
>> y = [1 2 1 2]
y =
    1     2     1     2
>> plot ( x, y )  % Oops, looks line an "N" not a box
>> y = [1 2 2 1];
>> plot ( x, y )  % Better, but the bottom of the box is missing
>> x = [ x 1 ]
x =
    1     1     4     4     1
>> y = [ y 1 ]
y =
    1     2     2     1     1
>> plot ( x, y )
>> axis( [0 5 0 3] )
>> axis equal
- Describe x and y coordinates on curve as separate functions of
some other variable
- x = x(t)
- y = y(t)

- Example
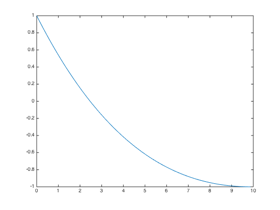
% Parametric curve x = t^2, y = cos(t)
>> t = linspace( 0, pi, 200 );
>> x = t .^ 2;
>> y = cos(t);
>> plot( x, y );
- Work on plotting lab