Purpose
This problem set familiarizes you with the concept of a limit, and with some ways of using technology related to limits.
This problem set addresses the following learning outcomes:
- “Limits and Derivatives,” outcome number 1
- “Technology,” outcome number 7.
Background
This problem set draws on the “Intuitive Definition of a Limit” subsection of section 2.2 in our textbook. It also requires you to use Mathematica to plot graphs, and Mathematica or other technology to evaluate functions. All of this material was covered in class on September 3 and 4.
Activity
Solve the following problems:
Question 1
(Expanding on Exercises 32 through 34 in section 2.2 of Calculus Volume 1 for SUNY Geneseo)
Part A
Generate a table of values of the function
Part B
Based on this table, estimate the value of
Part C
Use Mathematica to plot
Part D
(This part exceeds what you need in order to meet the learning outcomes for this
question, because it asks you to connect a limit to other areas of math.) What
often-used mathematical constant does
Question 2
Consider the function
Part A
Using Mathematica or other technology, calculate enough values of
Part B
Use Mathematica to plot
Question 3
Here is a graph of a function
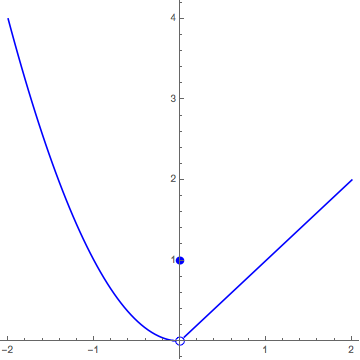
Part A
Based on this graph, what do you estimate
Part B
Based on this graph, what do you estimate
Part C
Based on this graph, what are
Question 4
Sketch a graph over the interval
Note that I’m only asking you to sketch a graph of such a function, not find an equation that defines it.
Follow-Up
I will grade this exercise during one of your weekly individual meetings with me. During this meeting I will look at your solution, ask you any questions I have about it, answer questions you have, etc. Sign up for the meeting via Google calendar. Please have a written solution to the exercise ready to share with me during your meeting, as that will speed the process along.