SUNY Geneseo Department of Mathematics
Math 221 02
Fall 2020
Prof. Doug Baldwin
This discussion reinforces some of the intuition behind limits that section 2.2 of the textbook presents. In particular, see the “Intuitive Definition of Limit” and “The Existence of a Limit” subsections for background on this discussion.
As usual, post responses to one or more of the following prompts. You may also respond to other people’s responses, of course. Make your posts before class time on Friday, September 4.
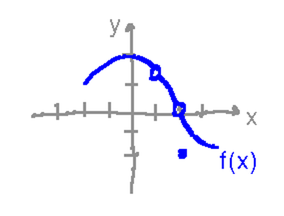
Particularly when discussing limits, the textbook uses some conventions about graphs of functions that it doesn’t define (at least not in chapter 2), but that hopefully make sense. To make sure they make sense, here is a roughly sketched graph of a function that uses the same conventions:
What, if anything, can you say about the value of f(0)? How do you know?
What, if anything, can you say about the value of f(1)? How do you know?
What, if anything, can you say about the value of f(2)? How do you know?
Consider the function
Notice that you cannot calculate
Ideally you will use the spreadsheet to collaboratively explore the function and speculate about its limit, i.e., each person will add a few numbers to the spreadsheet, post here about what they see and what it means for the limit, the next person will put some more numbers into the spreadsheet and post new observations, etc. But even if things don’t happen quite that way, please do comment on each other’s ideas about the limit, ask questions about them, suggest extensions or variations, etc.
Consider the function
Similar to Part 2, you can’t evaluate this function directly at
Use a table of values and/or a graph to determine whether
(i.e., the limit as