curvefunction in R?- All-in-one graph plotting function
- Basic usage is
curve( expression, low, high, ...options... ) add=TRUEoption adds new curve to existing plotcol="colorname"option sets color of linexname="variablename"option specifies name of variable in expression to vary for plotting> curve( pi - 2/x^2, -10, 10 ) > curve( x^3, -5, 5, add=TRUE, col="red") > curve( y^2, -10, 10, xname="y", add=TRUE, col="orange")
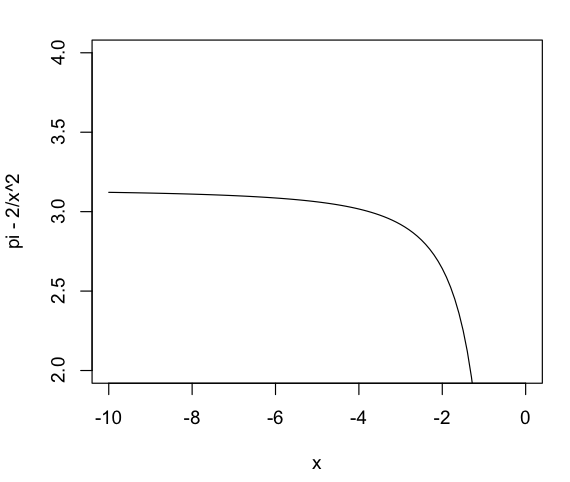
ylim=c(low, high)option sets range of Y values to show> curve( pi - 2/x^2, -10, 0, ylim=c(2,4))
- Removing a variable from R?
rmfunction does it> x = 1 > x [1] 1 > rm(x) > x Error: object 'x' not found
- RStudio is an R program with a nicer user interface
- First part of section 3.3
- Power rule for polynomials
- d( xn )/dx = n xn-1
- dc/dx = 0
- Constant multiple rule: d( cu )/dx = c du/dx
- d( 3x2 )/dx = 3 dx2/dx = 3 (2x) = 6x
- d( u + v )/dx = du/dx + dv/dx
- Notations
- d/dx
- Power rule for polynomials
- Examples
- 5x3 - 2x + 7
- d( 5x3 - 2x + 7 )/dx
- = 15x2 - 2
- x √x
- = x x1/2
- = x3/2
- d( x3/2 )/dx = 3/2 x1/2 = 3√x / 2
- x2 / 3√x
- = 1/3 ( x2 / √x )
- = 1/3 ( x2 / x1/2 )
- = 1/3 ( x3/2 ) (algebra)
- d( 1/3 ( x3/2 ) )/dx
- = √x/2 = 1/2 (x1/2) (power rule, constant multiple)
- 1 / x3
- = x-3
- d( x-3 )/dx = -3x-4 (power rule)
- = -3/x4
- 5x3 - 2x + 7
- Suppose f′(x) = 3x2 and g′(x) = x3 - 1.
What is the derivative of 3f(x) - 2g(x)?
- Method 1, the natural approach
- 3f(x) - 2g(x)
- = 3x3- 2(1/4 x4 - x )
- d( 3x3 - 2(1/4 x4 - x ) )/dx
- = 9x2 - 2x3 + 2
- Or, the simple approach
- d( 3f(x) - 2g(x) )/dx
- = 3 f′(x) - 2 g′(x)
- = 9x2 - 2x3 + 2
- What can you say about what f(x) is? How about g(x)?
- f(x) = x3 + C
- g(x) = 1/4 x4 - x + C
- Antiderivatives aka indefinite integrals
- Method 1, the natural approach
- Position (s), velocity (v), and acceleration (a)
- v = ds/dt
- a = dv/dt
- Constant acceleration a
- v = at + C
- s = 1/2 at2 + Ct + K
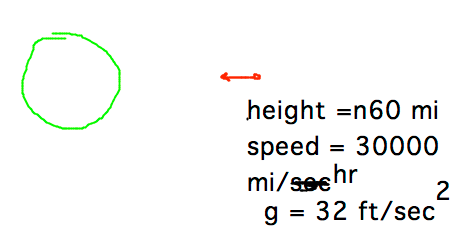
- Meteor
- Height = 60 miles
- Speed = 30000 mi/hr
- g (=a) = 32 ft/sec2

- Height = -1/2 (32 ft/sec2)t2 - 30000 mi/hr t + 60 mi
- Normals (perpendiculars) to curves
- Product and quotient rules
- Higher-order derivatives
- “Products and Quotients” part of section 3.3
- Top of page 122 - bottom of 124