- Math Learning Center open in South 332
- 10:30 AM - 3:30 PM + 7:00 PM - 10:00 PM most days
- Exceptions
- W afternoon close at 2:30 (open evening though)
- No evening hours Fridays
- Closed Saturdays
- No daytime hours Sundays
- Other editions of textbook
- Not recommended
- Section, exercise, and page numbers may trip you up
- But if you’re willing to take the risks you can
- “Limits of Function Values” part of section 2.2
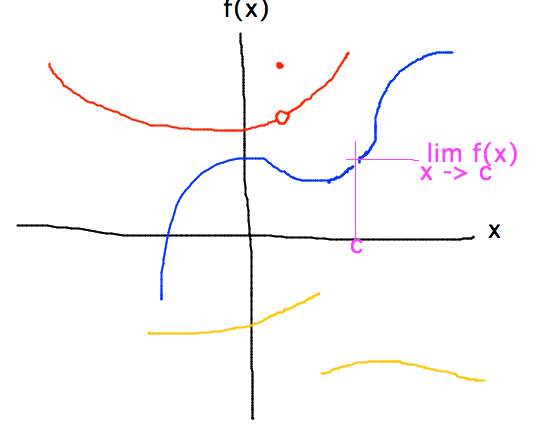
- Holes in graphs where function value doesn’t follow pattern
- e.g., because function is undefined there, or because function
is defined piecewise
- Sometimes because of division by zero
- Fix by cancelling out common factors in numerator and denominator
- limx→cf(x) = L means “limit of f(x) as x approaches c is L”
- Some functions have no limit at certain points because they
are discontinuous there

- Look at this in R
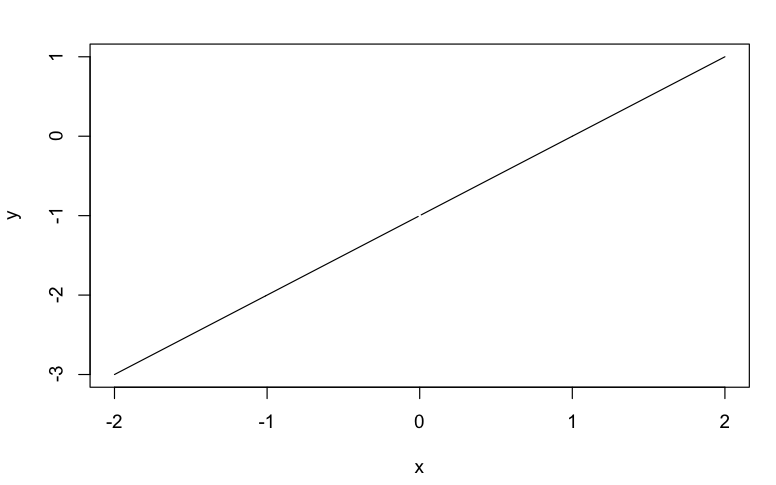
- e.g., for function f(x) = (x2-x)/x
> x = seq(-2,2,by=0.1)
> x
 [1] -2.0 -1.9 -1.8 -1.7 -1.6 -1.5 -1.4 -1.3 -1.2 -1.1 -1.0 -0.9 -0.8 -0.7 -0.6 -0.5 -0.4 -0.3 -0.2 -0.1  0.0
[22]  0.1  0.2  0.3  0.4  0.5  0.6  0.7  0.8  0.9  1.0  1.1  1.2  1.3  1.4  1.5  1.6  1.7  1.8  1.9  2.0
> y = (x^2 - x) / x
> y
 [1] -3.0 -2.9 -2.8 -2.7 -2.6 -2.5 -2.4 -2.3 -2.2 -2.1 -2.0 -1.9 -1.8 -1.7 -1.6 -1.5 -1.4 -1.3 -1.2 -1.1  NaN
[22] -0.9 -0.8 -0.7 -0.6 -0.5 -0.4 -0.3 -0.2 -0.1  0.0  0.1  0.2  0.3  0.4  0.5  0.6  0.7  0.8  0.9  1.0
> plot( x, y, type="l")
- Note gap in plot where (x2-x)/x is undefined and so
R can’t calculate a value
- Make this gap as small as you like by making step size between
x values smaller
x = seq(-2,2,by=0.01)
- Make this gap as small as you like by making step size between
x values smaller
- e.g., for function f(x) = (x2-x)/x
- Examples: calculate some limits
- limx→0f(x) for the function graphed here

- Visually, limit is 2 or a little less
- limx→1f(x) for the same function
- Limit is 1 despite function being undefined there
- limx→0|x|
- Visualizing graph of |x|, limit must be 0
- Could also figure that limit = |0| because |x| is continuous at x = 0
- But note that a function similar to |x| but discontinuous at
x = 0 could also have a limit of 0 as x approached 0

- limx→0f(x) for the function graphed here
- Problem Set
- Some rules for calculating limits
- Read rest of section 2.2
- Pages 51 - 55