SUNY Geneseo Department of Computer Science
CSci 242, Spring 2013
Prof. Doug Baldwin
Due Wednesday, January 30
Solve each of the following problems.
Explain how a graph can describe which procedures in a program call which others. More precisely, the graph should represent every instance in which p1 and p2 are procedures and p1 could call p2 (for really picky program analysts, I am interested in a static “calls” relationship, i.e., as long as the text of p1 contains a call on p2, assume that p1 could call p2, regardless of whether any particular input causes the call to be made). What do vertices and edges in your graphs represent? Are your graphs directed or undirected?
As a concrete example of your representation, show the graph representing the following skeletal program:
    main() {
        call p(1)
        call q()
    }
    p(x) {
        if ( x > 0 )
            call p(x-1)
        else
            call q()
    }
    q() {
        call r()
    }
    r() {
        call s()
        call q()
    }
    s() {
        return without calling anything
    }
Show the graph as a diagram, an adjacency list, and an adjacency matrix.
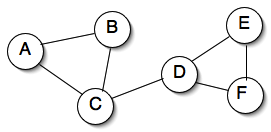
Find at least one example of each of the following in the graph shown below:

Problem B-2a in the textbook (page 1181).
Consider the following list of television shows and the times they play:
Define two shows to conflict if they ever play at overlapping times. For example, “Evening News” and “Weekly Gossip Report” conflict because they play at overlapping times on Fridays; on the other hand “Evening News” and “Evening Gossip” do not conflict.
Explain how you could represent the “conflict” relationship between TV shows as a graph. Say what vertices and edges represent in your graph, and whether the graph is directed or undirected. Draw the graph for the shows listed above.
I will grade this exercise in a face-to-face meeting with you. During this meeting I will look over your solutions, ask any questions I have about them, answer any questions you have, etc. Even though we will have a chance to talk about your solutions, please bring them in writing to the meeting—that will speed things along.
Each meeting should take about 15 minutes. Please schedule your meeting by signing up on the schedule sheet outside my office or electronically via Google calendar. If you work in a group on this exercise, the whole group can have a single meeting with me. Make sure that your meeting ends by the end of the day on the due date above.