SUNY Geneseo, Department of Computer Science
CSci 141, Fall 2003
Prof. Doug Baldwin
Due Wednesday, December 3
There are a number of line drawings one can create by starting with a simple pattern and then recursively embedding it inside itself somehow. The results are related to mathematical objects called "fractals", and so images generated in this manner are often called "fractal" images.
In this lab, you will use the LineDrawing class that you worked
with earlier to draw various fractal shapes. Recall that you can Download
LineDrawing from http://cs.geneseo.edu/~baldwin/sc/LineDrawing.java,
or get a copy from our folder on the "Course Materials" file server,
and you can find Documentation
on the class at http://cs.geneseo.edu/~baldwin/sc/doc/
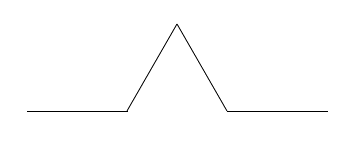
One of the simplest fractal curves is the so-called "Koch curve". The basic Koch curve shape is as follows:

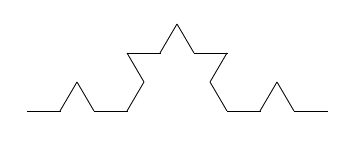
To create a Koch curve, replace each segment in this shape with a smaller copy of itself:

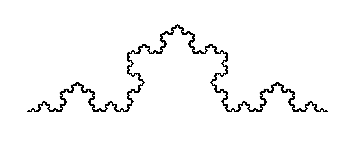
Now replace each segment in this shape with a smaller copy of the basic shape, and each segment in the result with a yet smaller copy, and so on. Here's what happens if you continue the process through 7 levels of replacement:

As the number of levels of replacement increases, Koch curves show a complex beauty. For an even more striking figure, join three Koch curves as if they were the sides of a triangle, to create the so-called "Koch snowflake":

Here are the technical details for drawing Koch curves: The basic shape contains four segments, the first and fourth (reading from the left) heading in the same direction, the second angled 60 degrees counterclockwise from this direction, and the third angled 60 degrees clockwise. It is often convenient to talk about the number of "levels" of embedding of basic shapes in a Koch curve -- the basic curve is 1 level, 0 levels is a straight line. In general, you draw a k level Koch curve by drawing 4 k-1 level Koch curves, angled relative to each other as described above. Each segment in the k-1 level curves is 1/3 as long as the segments in the k level curve.
One of the oldest uses of fractals in graphics is to generate terrains. As a simple example, consider the following technique for drawing an outline of a mountain:
Start with a straight line:

Take the midpoint of this line, and move it upward by a random amount:

Now you have two shorter lines. Recursively repeat the same process with each of them, i.e., randomly displace their midpoints to get two shorter segments, displace their midpoints, etc. Stop when the individual segments are too short to be worth splitting. Draw only these shortest segments. Here's a sample final result:

You need to know several technical details to make realistic-looking skylines: While the displacements of midpoints need to be random, their ranges of possible values should be proportional to the length of the line segment. You should allow downward displacements as well as upward, although if the first displacement is downward it will produce a cross-section of a valley rather than an outline of a mountain -- this is OK, it's why I called these figures "skylines" rather than "mountains". As with the previous fractal figures, you can think of skylines as having levels. A 0 level skyline is a straight line; a k level skyline is two k-1 level skylines connecting the endpoints of the skyline to the displaced midpoint.
I described the skyline algorithm in terms of lines drawn to displaced
midpoints. But the LineDrawing class doesn't have messages to draw
line between points, it has messages to draw lines of a certain length and a
certain heading. You can calculate new headings and distances for drawing skylines
as follows: Suppose you are going to split a baseline of length x
into halves and displace the midpoint by distance d:
![[New Segment is Hypoteneuse of Right Triangle with Side x/2 and d]](fractalizing.gif)
The shorter segment that you will either draw or recursively split again is the hypoteneuse of a right triangle whose other sides have length x/2 and d. You can thus use the Pythagorean Theorem to calculate the length of this line. Futhermore, the angle it makes with the original line (Theta in the above diagram) has tangent d/(x/2), so you can calculate the amount by which to change the pen's heading as arctan( d/(x/2) ).
Java's Math class provides several static methods
that will help you do these calculations. Method Math.sqrt calculates
the square root of its argument. Both the argument and result are double-precision
real numbers. For example
double length = Math.sqrt( y );The Math.atan method calculates the arctangent of
its argument. The argument and result are both double-precision real numbers.
The result is implicitly in radians. To convert to degrees (which LineDrawing
uses), multiply by 180/Pi. The Math class even provides a definition
for Pi, in constant Math.PI. Thus, you can calculate the angle
in degrees that has tangent t as
double angle = Math.atan( t ) * 180.0 / Math.PI;You can generate random numbers on which to base displacements
using Java's Random class. See the on-line introduction to Random
Numbers in Java at http://cs.geneseo.edu/~baldwin/reference/random.html
for information on using this class. The nextGaussian
message is a good way to get random numbers suitable for skylines.
You can draw a figure that looks something like an elaborate star, a snowflake, or lace (depending on your imagination and the complexity of the figure) by drawing a collection of lines radiating from a central point, and then drawing smaller "stars" at the end of each.
To describe these figures more precisely, use recursion:
Note that the lines in the (n-1)-level stars need to be shorter than the lines in the n-level star. Also note that although I defined stars to have 5 lines, you can actually use different numbers, and get different appearances.
For example, here is a 1-level star:
![[5 Lines Radiating from a Center]](star1.gif)
To show the recursive nature of stars, here is a 3-level star:
![[Star with Stars with Stars on the Ends of the Lines]](star3.gif)
To show the complexity "stars" can attain, here is a 5-level star based on 7 rather than 5 lines:
![[Lace-Like Pattern]](star5.gif)
To make stars even prettier, you can color the lines drawn at each level differently (look at this handout on the Web for examples).
Define a subclass of LineDrawing that provides messages for drawing
Koch curves, skylines, and stars. Each message can take the number of levels
and/or an initial size as its parameters. For each figure, derive a formula
for the number of movePen messages your method sends in terms of
the number of levels in the figure.
In designing these algorithms, it will be extremely helpful to adopt a set of pre- and postconditions on the pen's heading and position for each algorithm, and keep them firmly in mind as you design the algorithm.
I strongly encourage you to derive the formulas for number of movePen
messages before giving in to any urge you might feel to test
your methods on many-level figures. The formulas have useful things to tell
you about how long these tests might run. The recurrence for the "star"
algorithm will probably be slightly different from ones you have seen in the
past. Item 3 in Exercise 7.4 in The Science of Computing presents
a formula for sums of powers of constants that might be helpful in guessing
the closed form for this recurrence.
Finally, I am leaving you a lot of room to design the algorithms for this lab. The "Background" section gives you general ideas, but deliberately says as little as possible about specific algorithms -- I think that by now you are up to the challenge of designing these algorithms largely on your own. I will offer one hint/reminder 'though: All the algorithms will be recursive, and all will have recursive cases that send two or more recursive messages.
movePen messages. These
derivations may be clearest on a separate sheet of paper, but they can be embedded
in comments in your code if you wish.