Calibration of the Plasma Calorimeter Results
Calibration of the Plasma Calorimeter
ABSTRACT
We are currently developing a technique for calibrating a plasma calorimeter to be used at the Laboratory for Laser Energetics (LLE). The plasma calorimeter at the Laboratory of Laser Energetics is being calibrated at the Geneseo Nuclear Structure Laboratory (GNSL) at the State University of New York at Geneseo. Preliminary calibrations of several calorimeters have been carried out using proton beams of several hundred keV from the GNSL. We plan to continue to refine the calibration technique and to develop a fast, reliable, and accurate method of calibrating the plasma calorimeters. The results of the Geneseo calibrations will then be compared to calibration constants obtained at the LLE and also to the results of other diagnostics at the OMEGA 60 laser.
1. INTRODUCTION
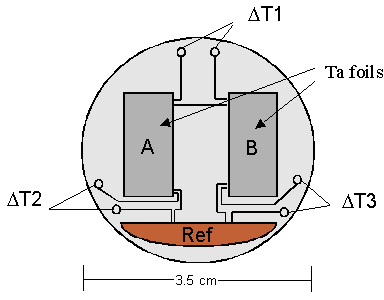
We are currently developing a technique for calibrating the plasma calorimeters which are used at the Laboratory for Laser Energetics (LLE). The calorimeter is a diagnostic tool that is used to study energy contained within the fusion plasma. Seventeen of these calorimeters are placed around the target area of the OMEGA 60 laser. The calorimeter consists of two 6 micron thick tantalum foils placed side by side (see figure 1). The foils are 6 mm wide and 13 mm high. One foil is open to the fusion plasma and the other is covered by a UV filter. Thermocouples are mounted on the foils which measure the temperature of the foils relative to a copper reference plate (DT2 and DT3). An additional set of thermocouples is used to measure the temperature difference between the right and left foil (DT1).
 |
where Pinc is the incident power, A is the area of the foil, s is the Stefan Boltzmann constant, e is the emissivity of the foil, k is a constant which characterizes the power lost to thermal conduction, T is the temperature of the foil, and T0 is the temperature of the surroundings, or the ambient (room) temperature. If we now define the temperature change as  is the exponential decay constant. Let's now calculate the temperature change caused by a short burst of power incident on the foil that lasts an amount of time Dt. We will assume that this burst is short compared to the thermal time constant (i.e. l Dt << 1). In this case, the temperature reached by the foil is given by
| (3) |
Note that s is the slope near the origin and C is a parameter which characterizes the amount of curvature.
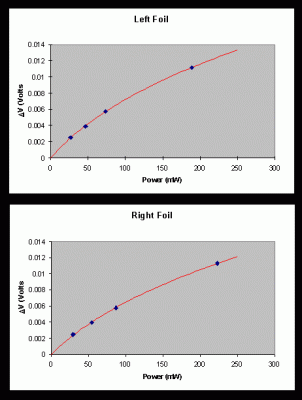
The calibration procedure is as follows. At SUNY Geneseo, we measure all quantities on the right hand side of equation (2), keeping in mind that these quantities need to be measured in the limit of small temperature increases. The quantity DVmax/Pinc for small temperature increases is measured by plotting the DVmax versus Pinc and fitting these data with the function as given in equation (3). The value of DVmax/Pinc in the low-temperature limit is equal to the fitting parameter s in equation (3). The technique by which the low-temperature decay constant l is determined will be explained in the next section.
3. PRELIMINARY DATA
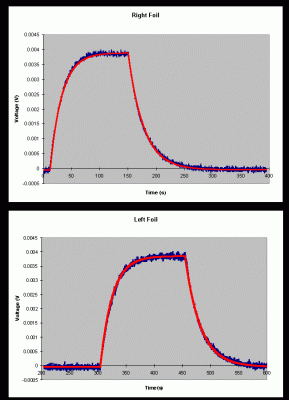
In December 1998, a series of data was obtained at the Geneseo NSL. A portion of these data is shown in figure 3. A 0.450 MeV proton beam was incident on each foil for a time interval of approximately 2.5 minutes. The beam current was approximately 0.104 mA. The top plot in the figure shows the temperature difference between the right foil and the reference plate. The bottom plot in the figure shows the difference in temperature between the left foil and reference plate. When the beam is turned on, notice that the temperature of the right increases and then levels off as the foil reaches thermal equilibrium. The beam is then shut off, causing the temperature difference to return to zero as the foil radiates energy.
A least squares fit has been performed on these data to determine the heating exponential decay constant (a), the cooling exponential decay constant (b), and the maximum voltage increase at equilibrium (DVmax). This procedure was repeated for both the left and right foils of several calorimeters at several different beam currents. The data obtained in these runs for calorimeter #31 is shown in table 1.
|
The line in the figure represents the results of this fit. The fitting parameters obtained were s = 105 mV/W and C = 15 W-1 for the left foil, and s = 91 mV/W and C = 13 W-1 for the right foil. Figure 5 shows the exponential decay constants a (heating) and b (cooling) as a function of incident power for the left and right foils of calorimeter #31. In the limit of low power, the heating and cooling time constant are the same, and are independent of incident power. If the temperature change is not small, however, the exponential solutions to the differential equation are no longer valid. It is the nonlinearity of the differential equation that causes the power dependence of the measured decay constants. It is interesting to note that the cooling decay constant shows much less dependence on incident power than the heating decay constant. It is for this reason that we use the y-intercept of the line through the cooling decay constants (b) to determine the low-temperature decay constant l that is needed in the final calorimeter calibration.
Table 2 shows the results of the preliminary calibration data. In January 1999 we conducted experiments at the LLE to obtain a preliminary calibration of calorimeter #31. The calorimeter response was studied as a function of energy incident upon it. The final result obtained in these experiments was 6.5 mV/J, which is significantly higher than the results obtained at SUNY Geneseo. The cause of this discrepancy is still under investigation.
Table 2: Final results from the preliminary calibration data.
4. STATEMENT OF WORKWe plan to fully develop a reliable, and accurate calibration technique that can be quickly set up to calibrate a number of calorimeters in a short amount of time. We will also investigate the discrepancy between the calibration performed at LLE and the calibration at SUNY Geneseo. One possibility for the discrepancy between these results is that the measurement of the beam current provided by the electrometers placed on the calorimeter foils could be incorrect due to inadequate biasing of the electrometer foils. We plan on placing a thin gold foil and surface barrier detector in the target chamber (see figure 2), which will allow us to monitor the beam current via Rutherford scattering. Once the calibration technique has been established, we also plan on performing an end-to-end calibration of the calorimeters at SUNY Geneseo using the entire LLE electronics chain. The results of the Geneseo calibrations will then be cross-checked with calorimeter calibrations performed at LLE. In addition, the calorimeter data can be checked for consistency with other diagnostic techniques used at the OMEGA 60 laser. 5. CONCLUSIONWe have been working in conjunction with James Knauer of the LLE on calibrating the plasma calorimeter. We have carried out preliminary tests of the calibration technique using the 2 MV Van de Graaff accelerator at the Geneseo Nuclear Structure Laboratory (GNSL). We plan on continuing to refine the calibration procedure so that a fast, reliable, and accurate calibration technique can be established at the GNSL. The results of the Geneseo calibrations will then be checked with results obtained at OMEGA.
|

